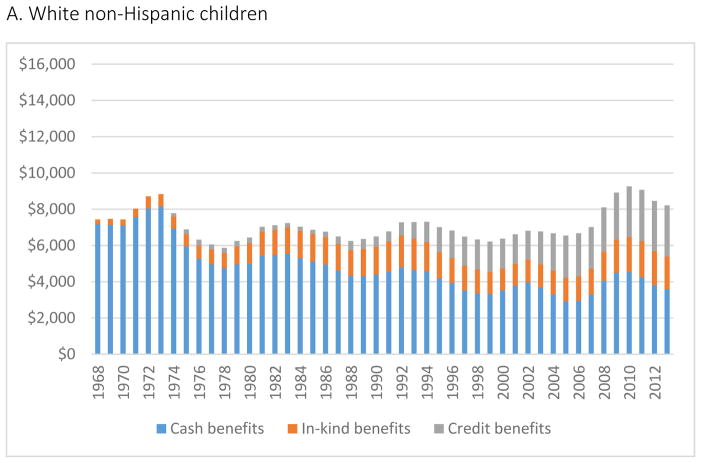
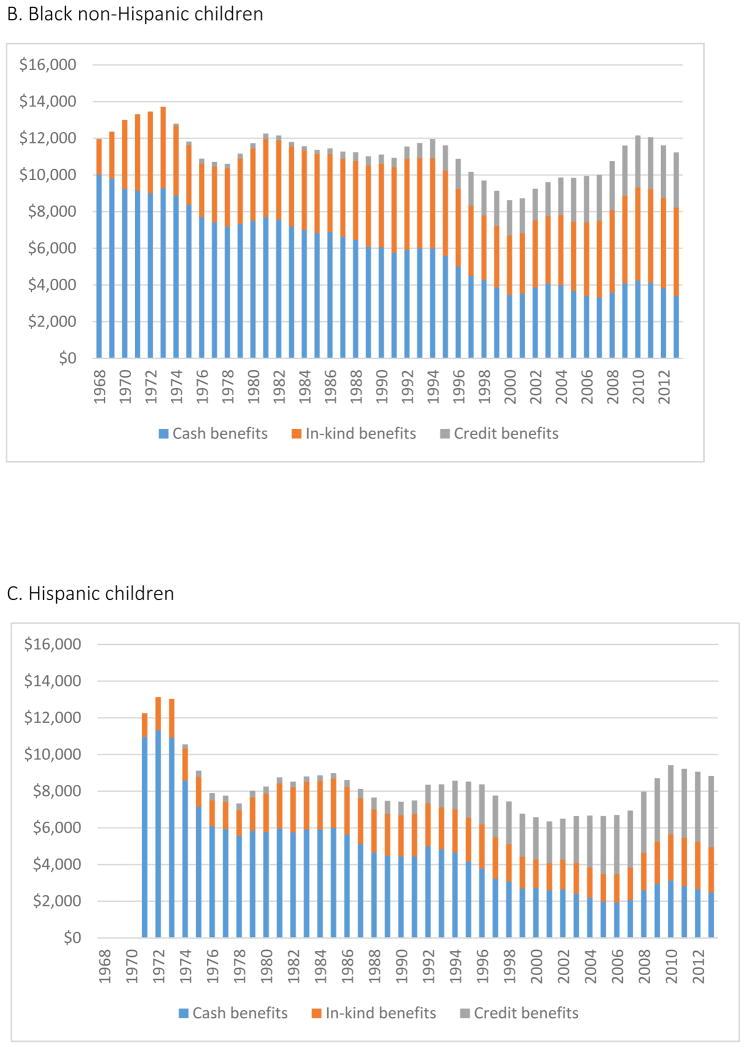
Figure 9.
Trends in the average value of benefits for 0–5 year olds receiving benefits from 1968–2013, by race/ethnicity
Notes: Cash benefits include AFDC/TANF, public assistance programs, Supplemental Security Income, Social Security Income, Unemployment Insurance. In-kind benefits include Food Stamp/SNAP, housing subsidies, and WIC. Credit benefits include EITC and CTC. All years adjusted to 2013 constant dollars.
Notes: Cash benefits include AFDC/TANF, public assistance programs, Supplemental Security Income, Social Security Income, Unemployment Insurance. In-kind benefits include Food Stamp/SNAP, housing subsidies, and WIC. Credit benefits include EITC and CTC. All years adjusted to 2013 constant dollars.
Notes: Cash benefits include AFDC/TANF, public assistance programs, Supplemental Security Income, Social Security Income, Unemployment Insurance. In-kind benefits include Food Stamp/SNAP, housing subsidies, and WIC. Credit benefits include EITC and CTC. All years adjusted to 2013 constant dollars. This graph begins at 1971 because Hispanic children are only identifiable in the CPS ASEC from 1970 onward.


