
Figure 5.
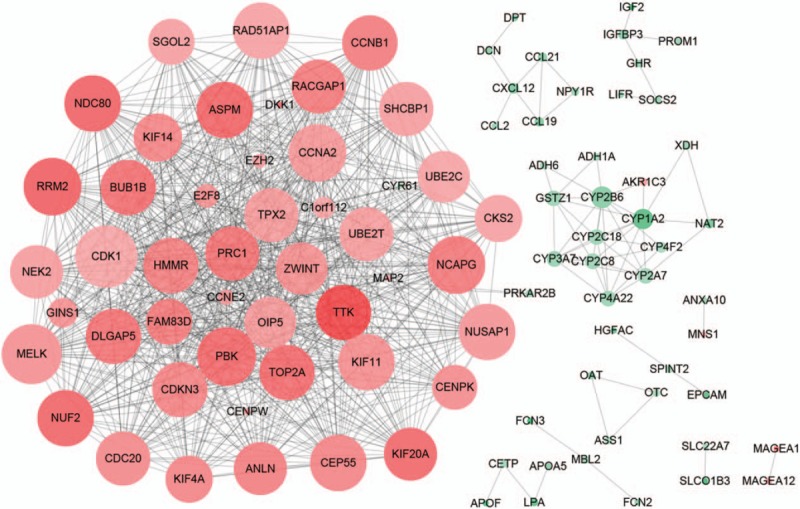
Protein-protein interaction network of differentially expressed genes. Red nodes represent upregulation, whereas green nodes represent downregulation. The lighter the nodes, the larger the degree of difference is. The higher the degree, the bigger the size is.