
Figure 2.
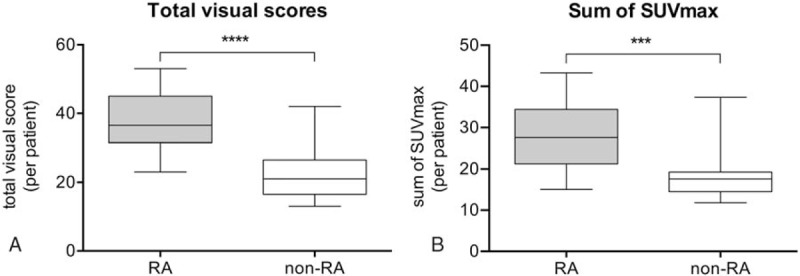
Box plot representation of the distribution of total visual scores (A) and sum of SUVmax (B) in RA and non-RA groups. Total visual scores (mean, 37.6 ± 9.0 vs 21.5 ± 7.2; P < .0001) and sums of SUVmax (mean, 28.1 ± 8.5 vs17.9 ± 5.81; P < .0001) in the RA group were significantly higher than those in the non-RA group. RA = rheumatoid arthritis, SUVmax = maximum standardized uptake value.