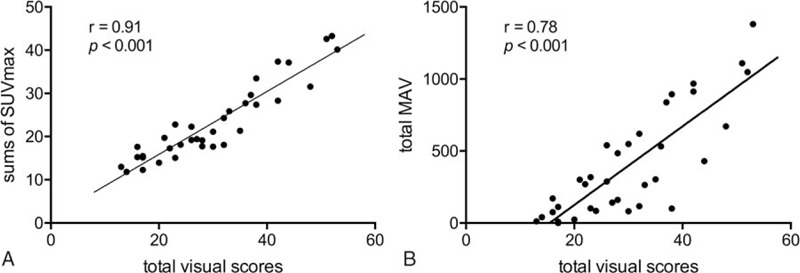
Figure 3.

Correlation of total visual scores with sum of SUVmax (A) and total MAV (B). A strong correlation of total visual score with sum of SUVmax (r = 0.91; P < .0001) and total MAV (r = 0.78; P < .0001) is observed. MAV = metabolic active volume, SUVmax = maximum standardized uptake value.
