
Figure 5.
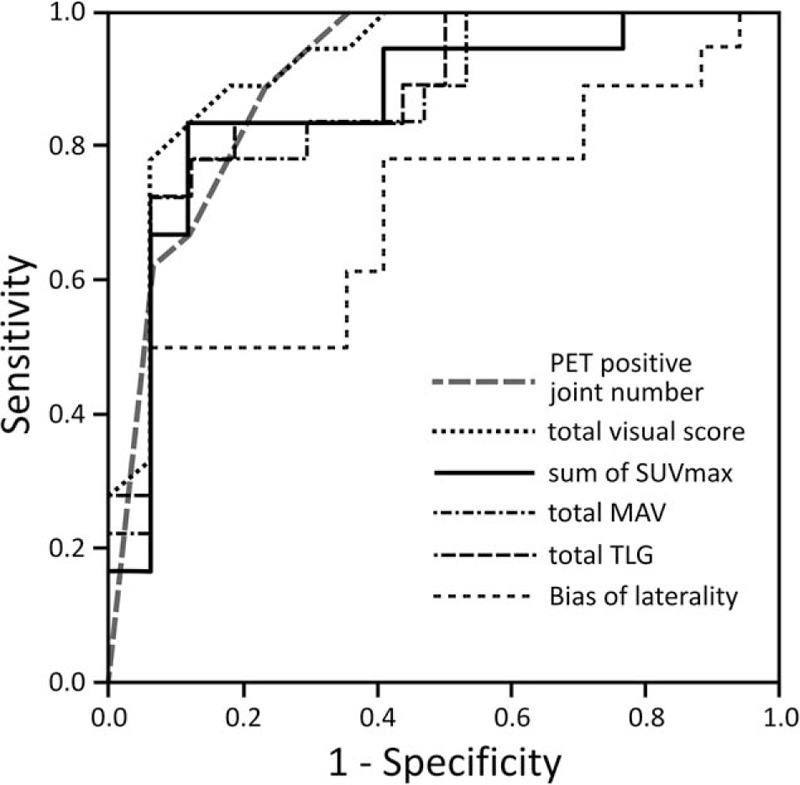
ROC curves for number of PET-positive joints, total visual score, sum of SUVmax, total MAV, total TLG, and laterality bias to differentiate RA from non-RA. Detailed results are given in Table 2. MAV = metabolic active volume, PET = positron emission tomography, RA = rheumatoid arthritis, ROC = receiver operating characteristic, SUVmax = maximum standardized uptake value, TLG = total legion glycolysis.