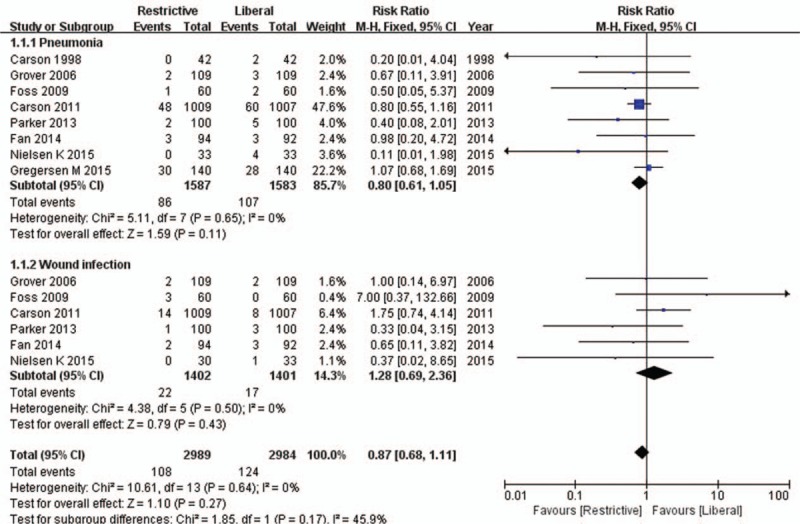
Figure 3.

Forest plot of infections. 95% CI = 95% confidence interval, df = degrees of freedom, Fixed = fixed effects model, IV = inverse variance, SD = standard deviation.

Forest plot of infections. 95% CI = 95% confidence interval, df = degrees of freedom, Fixed = fixed effects model, IV = inverse variance, SD = standard deviation.