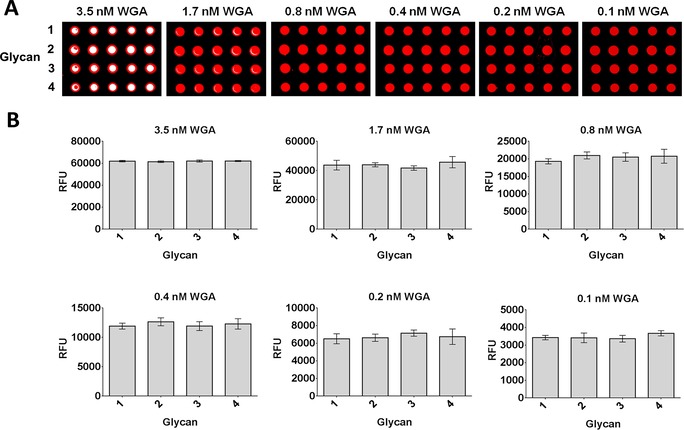
Figure 6.

Glycan microarray analysis of compounds 1–4 after binding with Alexa Fluor®‐647‐labeled WGA at increasing protein concentrations. A) Fluorescence images after incubation with different concentrations of WGA‐647. B) Fluorescence quantification after incubation with WGA‐647. Each histogram represents the average RFU values for five replicates with the standard deviation of the mean.
