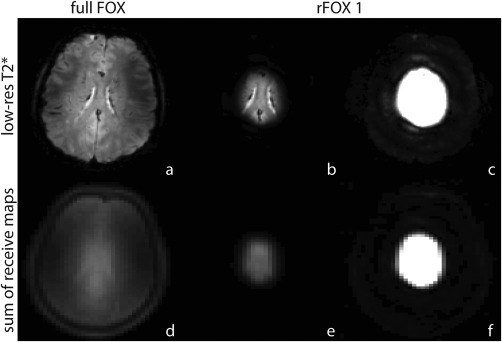
Figure 3.

Full FOX (a,d) and rFOX 1 (b,c,e,f) applied to T2*‐weighted images (a–c) and the receive coil sensitivity maps (summed signal, d–f). Panels c and f show the same data as b and e, but with a different intensity window to reveal low intensity signals.
