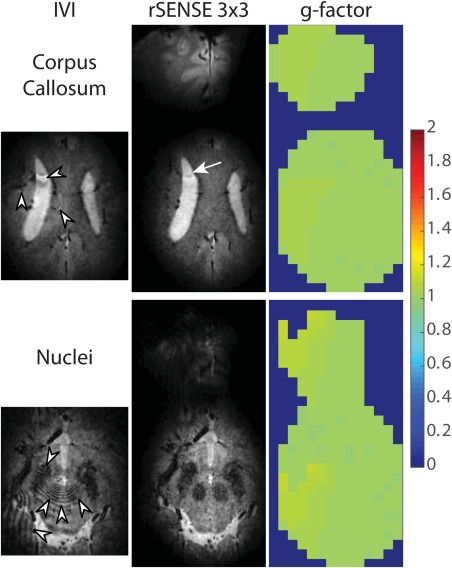
Figure 8.

Images of rFOX shape 2 acquired using IVI and equivalent rSENSE acceleration factor. Transverse reconstructed slices showing the corpus callosum and red nuclei are shown, as well as g‐factor maps for both locations. The rSENSE images and g‐factor maps are cropped around the signal generating areas. Arrow and arrow heads point to aliasing artifacts.
