
Figure 3.
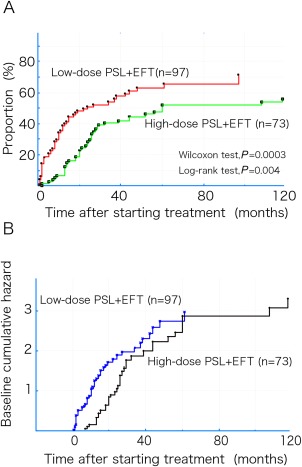
(A) Kaplan–Meier curves for first achievement of the treatment target (MM or better‐5mg for ≥6 months) in both groups of the EFT with the low‐ and high‐dose PSL regimens. (B) Time courses of the baseline cumulative hazard curves for both the low‐dose and high‐dose PSL groups as a function of time. EFT, early fast‐acting treatment; MM, minimal manifestations; PSL, prednisolone.