
Figure 3.
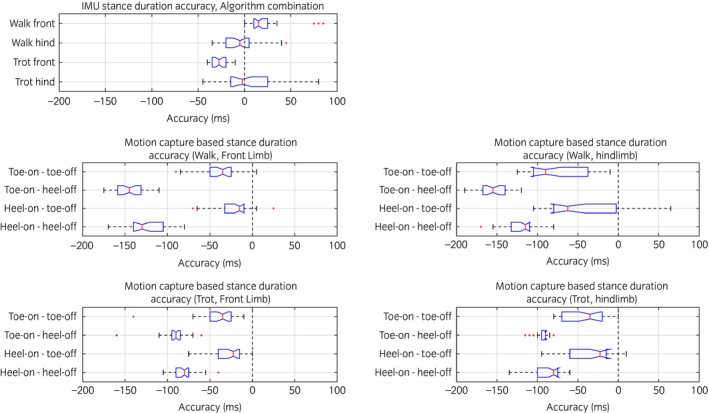
Horizontal box plot of the accuracy of stance duration. Top left, accuracy with inertial measurement unit (IMU) sensors with algorithm combination as described in Table 3. Remaining plots represent the stance duration calculated using the motion capture data and based on toe/heel‐on/off moments and possible combinations thereof. Positive accuracy indicates over estimation of the detected event (i.e. IMU or motion capture detection of the event later than force plate) and negative accuracy indicates under estimation of the event (i.e. IMU or motion capture detection of the event before force plate). Accuracy is higher closer to zero. The box represents the interquartile range, whiskers represent 75th percentile + 1.5 *interquartile range (IQR) and 25th percentile −1.5 *IQR, respectively. Notch represents the 95% confidence interval of the median.