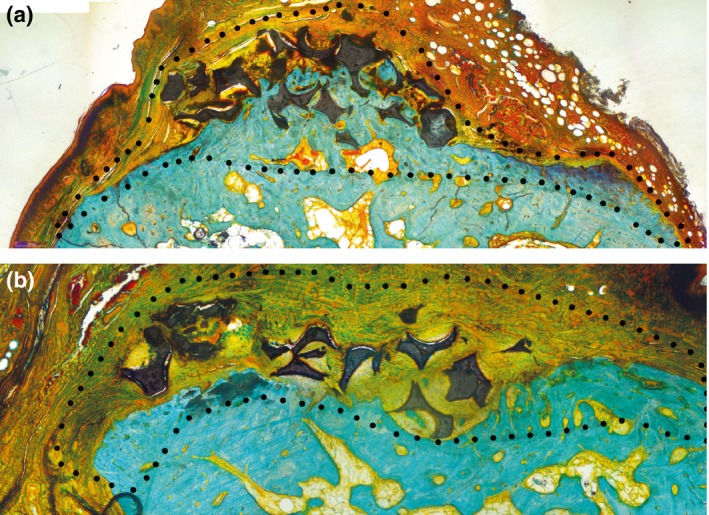
Figure 3.

(a) Representative histological section of a test group specimen with highlighted total augmented area (Masson Goldner trichrome staining). (b) Representative histological section of a control group specimen with highlighted total augmented area (Masson Goldner trichrome staining).
