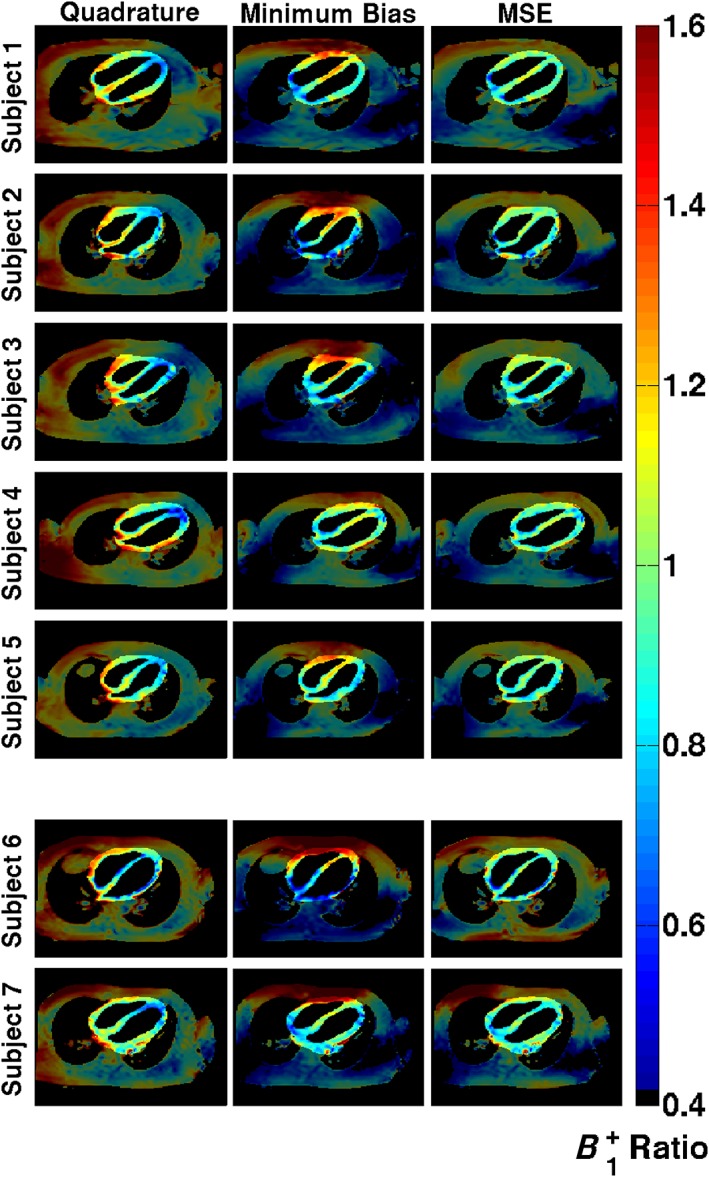
Figure 7.

B 1 + maps in the four‐chamber view shown for all subjects for quadrature, minimum bias and minimum squared error (MSE) shimming. Each map is normalized to the desired B 1 + value, so a value of 1.0 is ideal. The region of interest used for optimization is highlighted in each case
