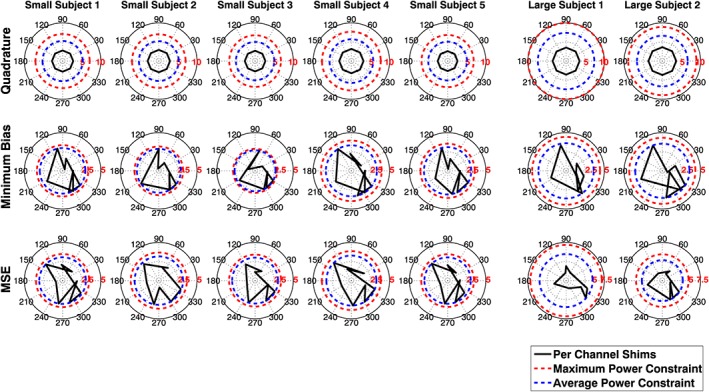
Figure 9.

Shim solutions w for each of the subjects for quadrature, minimum bias and minimum squared error (MSE) methods. The shim values w are complex and dimensionless – the amplitude corresponds to the relative scaling amplitude. They are plotted here on a polar diagram with phases defined such that quadrature operation is represented as an octagon – equal amplitude on each channel – as for the top row. The maximum and average power constraints are different for each plot because they depend on the pulse duration, TR and B 1 + scaling for each subject, according to Equation (17). In the shimmed operating regimes, it is always the average power constraint that is the limiting factor. Quadrature operation is specific absorption rate (SAR) limited, so does not encounter the hardware constraints
