
Figure 2.
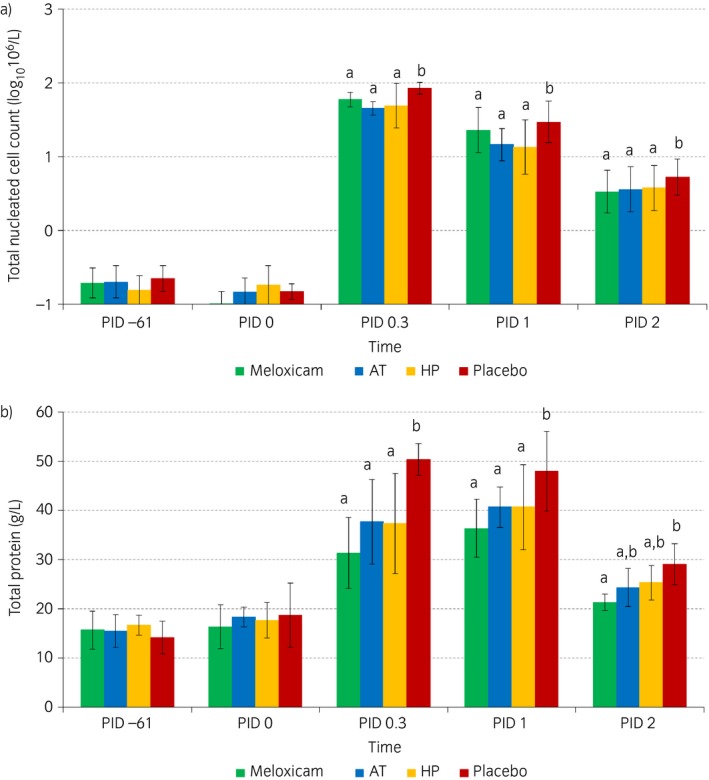
Logarithmically transformed a) mean total nucleated cell counts and b) mean total protein in synovial fluid in the different treatment groups (green: meloxicam; blue: supplement AT; yellow: supplement HP; red: placebo) over time (post‐injection days [PID] −61, 0, 0.3, 1 and 2). Within time points, outcomes in treatments with different superscripts show statistically significant differences.