
Figure 4.
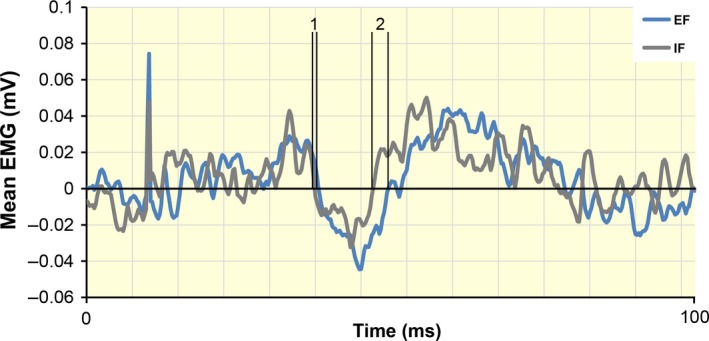
Group data of the mean electromyographical (EMG) activity (n = 10) during a sustained contraction of the right first dorsal interosseous (FDI) (10% of F max). The curves were obtained by subtracting the rectified EMG of the trials with subthreshold TMS from that of the trials without stimulation. The horizontal dashed line represents the mean level of background EMG. The vertical lines represent the onset of EMG suppression (1) and the end of EMG suppression (2). The amount of EMG suppression was significantly greater (P = 0.001) with an external focus of attention (EF, blue line) than with an internal (IF, grey line). No difference between the two foci was found for the onset and the duration of the suppression. TMS, transcranial magnetic stimulation.