
Figure 5.
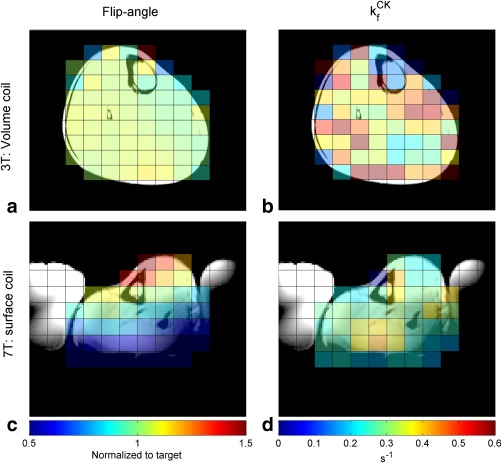
Flip‐angle (a) and (b) maps from the central slice of a three‐dimensional chemical shift imaging matrix in healthy volunteers calves, acquired at 3T, using a volume coil. The maps are masked by the outer anatomical border. Flip‐angle map (c) and map (d) at 7T using a surface coil. Saline bags, used for additional coil loading, are visible in the localizer images at 7T.
CK, creatine kinase; T, tesla.