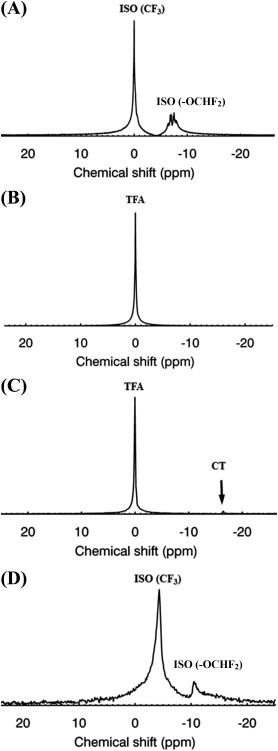
Figure 1.

A: Spectrum of a 2 mL ISO phantom. B: Corresponding spectrum of a 75 mM trifluoroacetic acid (TFA) phantom (50 mL). C: Spectrum of a 25 mM TFA phantom in the presence of collagenase‐trypsin (CT) progenitor cells labeled using PFCE‐containing NPs (arrow). The NP resonance (‐16.25 ppm) is distinct from the TFA resonance (0 ppm). D: Typical spectrum of ISO signals (corresponding to the ‐CF3 and ‐OCHF2 moieties) in a mouse in vivo. The spectrum was collected and averaged over a period of 5 min. All spectra were acquired using a birdcage coil.
