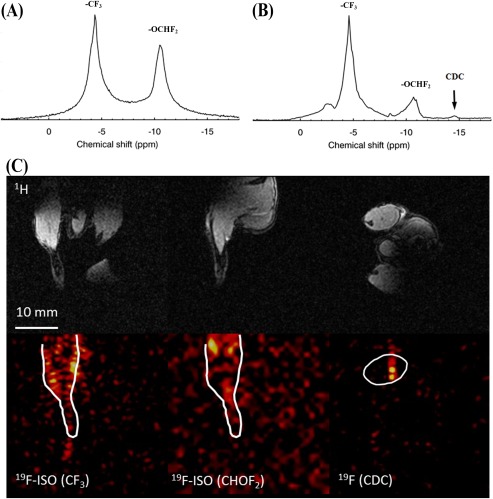
Figure 4.

A: Nonlocalized, post‐mortem 19F spectrum from a male mouse. Experimental data collected in this study demonstrated ISO persistence over 7 h post‐euthanasia. B: Corresponding 19F spectrum of the femoral region of the right leg of the mouse following injection of ∼2.5 million cells cardiosphere‐derived cells (CDC) with NP labels. The arrow indicates the peak corresponding to the labeled progenitors, distinctly separated from the ISO peaks. 1H (C) and (D) 19F images of the ISO peaks were acquired using the butterfly coil. The spatial boundaries of the right hindlimb obtained from the 1H MRI are overlaid on the 19F MRI.
