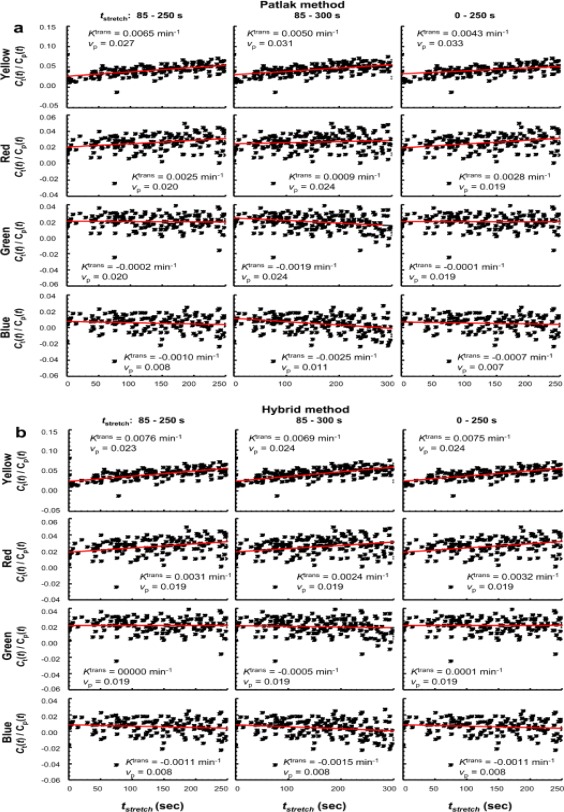
Figure 5.

Fitting the tissue CA uptake curves from each of the four color‐coded regions. The Patlak analysis (a) and the hybrid method (b) were used, with three t stretch intervals (left column: 85–250 sec; middle column: 85–300 sec; right column: 0–250 sec), respectively. The “measured” values of K trans and v p are shown in the panel for each fitting.
