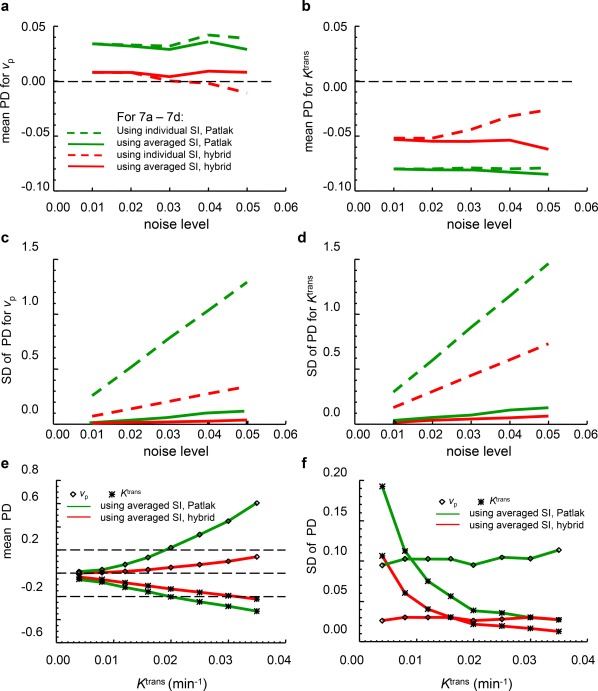
Figure 7.

PD analysis for K trans and v p estimates with varying noise levels (a–d), or with various backdiffusion levels (e,f). Mean (a,b) and SD (c,d) of percent deviations for v p (a,c) and K trans (b,d) calculated from 20,000 Monte Carlo repetitions of fitting individual SI‐time curves (dashed lines) and 200 Monte Carlo repetitions of fitting an average of 100 individual SI‐time curves (solid lines) using the Patlak (green) and the hybrid (red) methods. The tissue uptake curves in a–d were simulated with “true” values of K trans = 0.0074 min−1, v e = 0.20, and v p = 0.024. In e,f, the tissue uptake curves were simulated with varying “true” K trans (0.004–0.035 min−1) but with a fixed noise level of 4%. A t stretch interval 85–250 seconds was used in the fitting.
