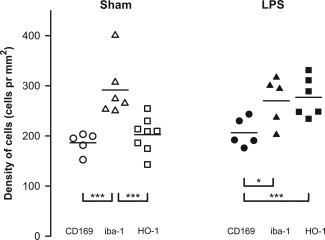
Figure 3.

Densities of immunostained macrophages (cells/mm2). Open symbols represent the sham‐treated animals and solid symbols represent the LPS‐treated animals. CD169pos cells are shown by circles, iba1pos cells by triangles, and HO‐1pos cells by squares. The horizontal lines indicate the group mean. Three asterisks indicate that the two cell populations are significantly different with a Bonferroni corrected P‐value below 0.017. One asterisk indicates a P‐value below 0.05.
