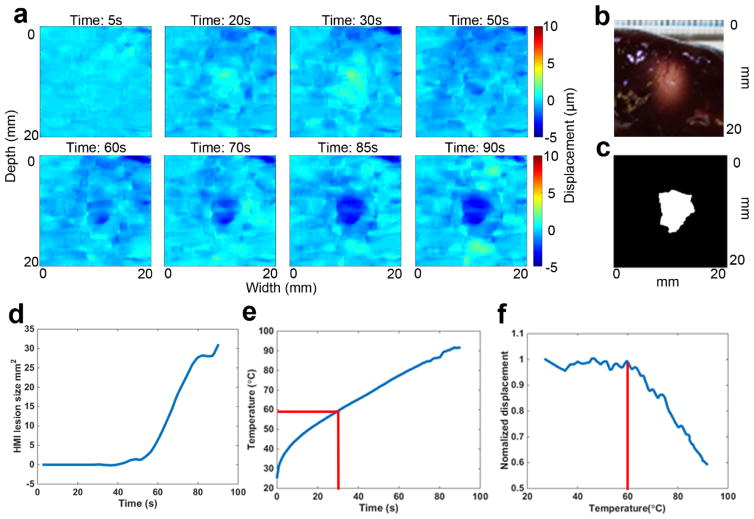
Figure 4.
Example case of HMIgFUS lesion monitoring on 90s ablation. Lesion developing overtime is shown in (a) with blue indicating the formation of the lesion. Gross pathology of the lesion (b) is shown along with the HMI lesion map at the end of ablation (c). (d) HMI lesion size development overtime. (e) Temperature measurement from thermocouple. (f) HMI displacement change during the ablation.

