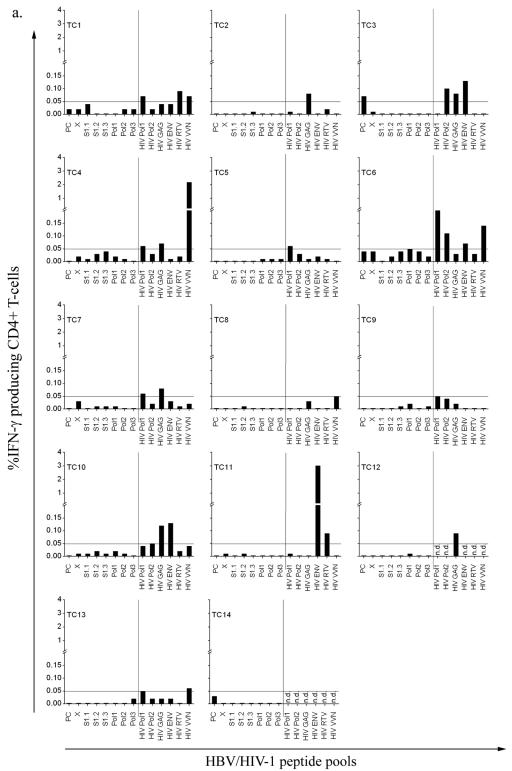
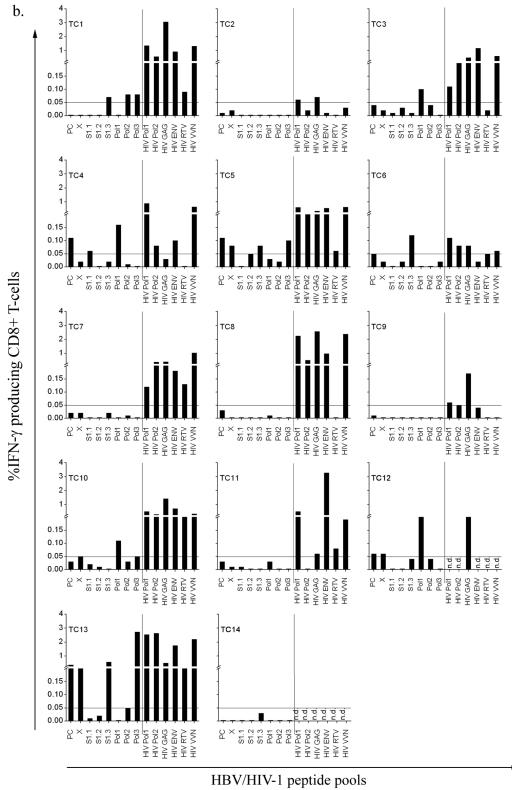
FIG. 4.
Intracellular IFN-γ production as a measure of HBV-specific T-cell responses in HIV-1-HBV-coinfected treated individuals (n = 14). CD4+ T-cell responses (a) and CD8+ T-cell responses (b) to stimulation with an HBV peptide pool of 1 μg ml−1 for each peptide are shown to the left of the vertical bars, and those to stimulation with an HIV peptide pool of 1 μg ml−1 for each peptide are shown to the right of the vertical bars. A response was considered positive if more the 0.05% of CD4+ or CD8+ T cells produced IFN-γ. n.d., not done.


