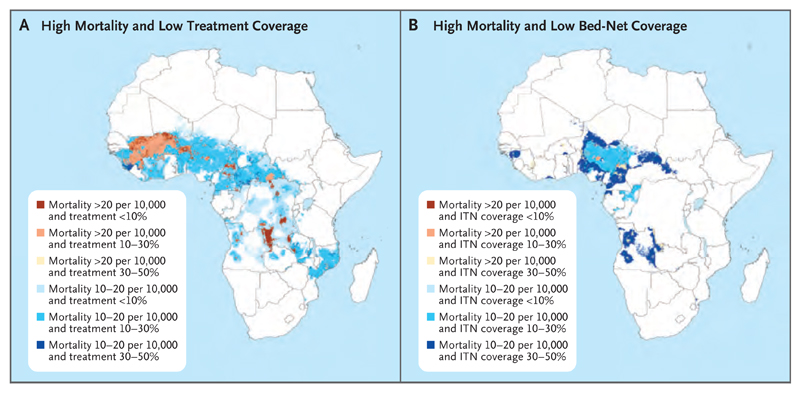
Figure 5. Identifying Regions with High Mortality and Low Malaria-Control Coverage.
Shown are areas with high mortality and low coverage of antimalarial treatment (Panel A) and areas with high mortality and low coverage of insecticide-treated bed nets (ITNs) (Panel B). Both maps show data for 2015. Data on bed nets were obtained from earlier geospatial mapping.

