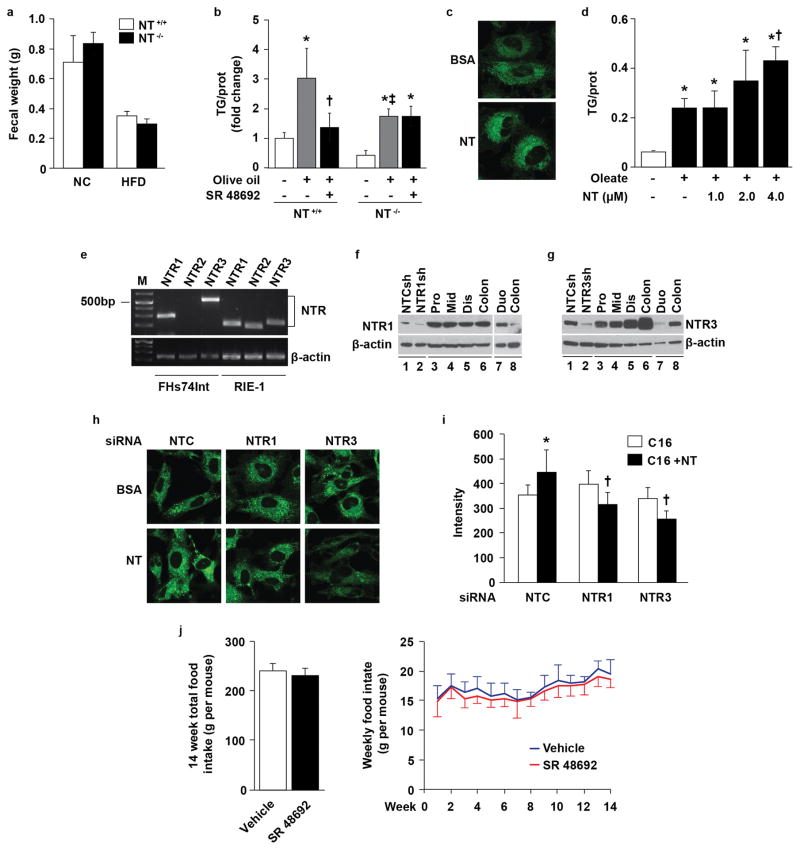
Extended Data Fig. 4. NT promotes intestinal cell lipid absorption or accumulation.
a. Fecal weight of male NT+/+ and NT−/− mice fed either normal chow (NC, NT+/+ n=4, NT−/− n=5) or HFD (NT+/+ n=7, NT−/− n=9) for 24wks; there was no significant difference between genotypes. b. Male NT+/+ and NT−/− mice (n=4) on normal chow were fasted overnight. Mice were injected with either saline or SR 48692 (2.5 mg/kg, i.p). Thirty min after the injection, mice were given olive oil (10 μl/g) by oral gavage and then sacrificed. The proximal small bowel was excised and intestinal TG content measured. *p<0.05 vs. saline in NT+/+ and NT−/− mice; † p<0.05 vs. olive oil only in NT+/+ mice; ‡ p<0.05 vs. olive oil only in NT+/+ mice. c. RIE-1 cells were pre-treated with BSA or NT (2 μM) for 30min, followed by incubation with BSA-conjugated BODIPY® FL C16 for 15min, and labeled lipids were visualized by confocal microscopy. Representative images are from 3 experiments. d. RIE-1 cells were pre-treated with or without NT at different concentrations for 30min followed by the addition of BSA-conjugated oleate (0.1 mM) and further incubation overnight. Cells were collected, lysed and TG was measured (n=3). * p<0.05 vs. BSA only; † p<0.05 vs. oleate only. e. Total RNA was isolated from human (FHs 74 Int) and rat (RIE-1) small intestinal epithelial cells and RT-PCR performed using specific primers targeting human or rat NTR1, 2 and 3. f–g. Expression of NTR1 (f) and NTR3 (g) was analyzed by western blot from mucosa scraped from mouse proximal (pro), middle (mid), distal (dis) small bowel and colon (lanes 3–6) as well as human duodenum (duo) and colon (lanes 7–8). Proteins from HepG2 (human hepatocellular carcinoma cell line) (e, lanes 1–2) and Caco-2 (human colon cancer cell line) (f, lanes 1–2) cells stably expressing NTR1, NTR3, or control (NTC) shRNA were used as positive and negative controls. h–i. RIE-1 cells transfected with non-targeting control (NTC) siRNA or NTR1 or NTR3 siRNA for 72h were treated with or without NT (2 μM) for 30min followed by BSA-conjugated BODIPY® FL C16 (C16) for 15min, and imaged by confocal microscopy to quantify fluorescence (h) and intensity (i) as described in Methods (n=30 cells). * p<0.05 vs. C16 in NTC siRNA; † p<0.05 vs. C16 plus NT in NTC siRNA. j. Cumulative (left panel) and weekly (right panel) food intake was measured in male wild type C57BL/6 mice fed HFD and chronically treated with either SR 48692 (n=13) or vehicle (n=12). Neither analysis demonstrated a significant difference. All data are mean ± SD. ANOVA with Holm’s p-value adjustment for a, b, d, i; two-sided, Student’s t-test for j (left panel); linear mixed model for j (right panel) (See Supplementary Fig. 1 for gel source data).

