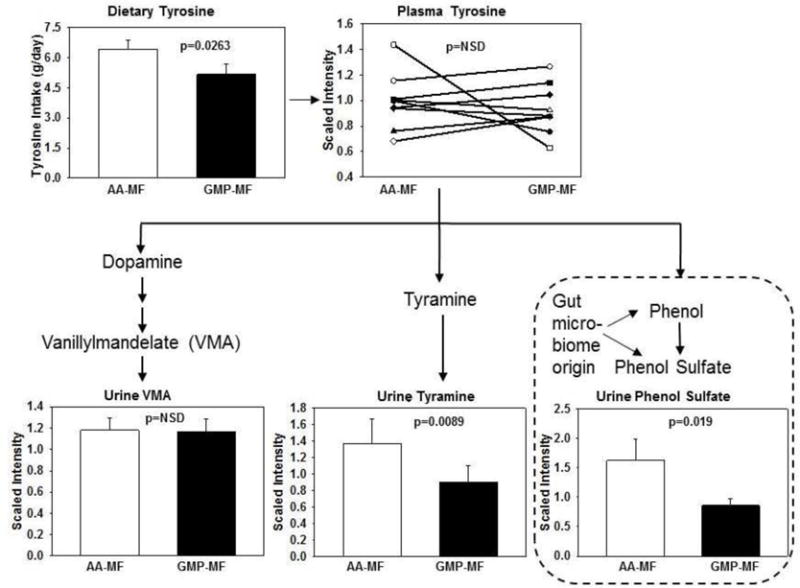
Figure 3.

Metabolomics analysis of Tyr metabolism. Values are mean scaled intensity ± SE for metabolites of Tyr in 24-hr urine collections from 9 PKU subjects (4 classical and 5 variant) consuming a low-Phe diet in combination with AA-MF or GMP-MF. Mean scaled plasma Tyr levels and mean ± SE dietary Tyr intake determined from food records are shown, n=9. Plasma Tyr and urine vanillylmandelate are not significantly different, P>0.05. Compounds within dashed lines are synthesized by intestinal microbes.
