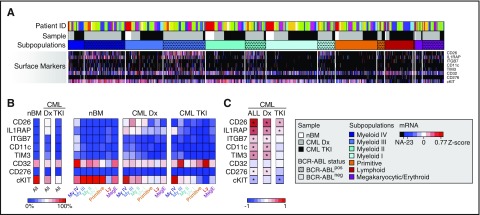
Figure 4.
Cell surface marker expression in CML LSCs changes during TKI treatment. (A) Cell surface marker expression extracted from the RFC heat map of single-cell gene expression (red indicates high expression, blue low expression, and black no expression). The rows represent mRNA expression for each marker, and the columns each single cell. The white boxes highlight BCR-ABLpos cells. (B) Heat map depicting the proportion of cells expressing mRNA for the indicated cell surface markers in the Lin−CD34+CD38−/low fraction of nBM samples, CML patients at diagnosis (CML Dx, n = 13), and of CML patients during TKI therapy (CML TKI, n = 10), as well as in each respective subpopulation (red represents high proportion, and blue low proportion). (C) Heat map of Spearman rank correlation coefficients for coexpression between BCR-ABL and indicated cell surface markers in all, diagnostic (Dx), or TKI-treated (TKI) CML-LSC samples, respectively (red indicates high correlation, and blue anticorrelation; *P < .05 according to Student t test).

