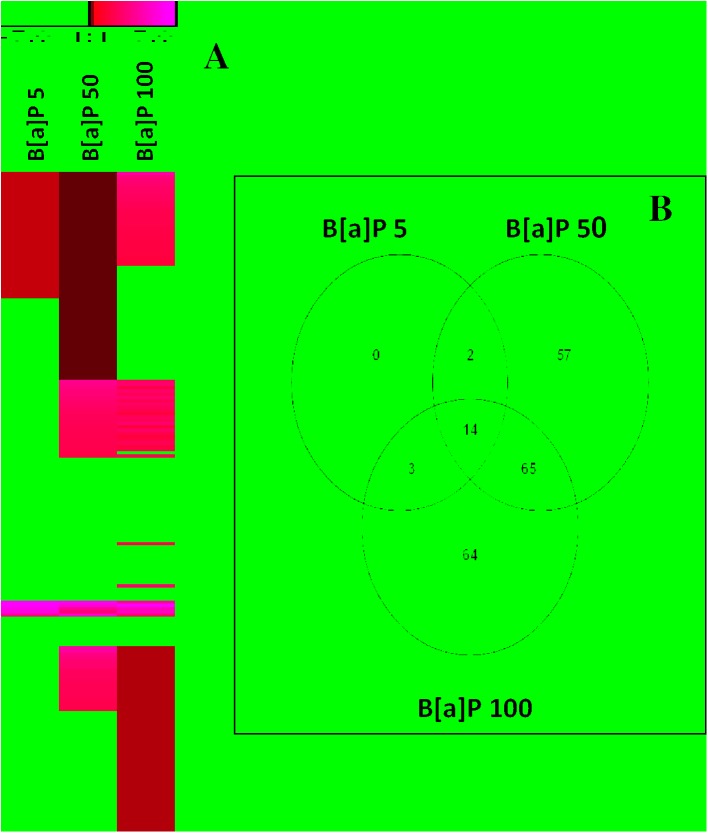
Fig 1. Mytilus galloprovincialis gene expression profiles of gills tissue in animals exposed to B[a]P (5μg/L, 50μg/L and 100 μg/L).
The heat map (A) (Pearson correlation, complete linkage algorithm) reports the log2 relative expression level with respect to the reference condition. 205 differentially expressed genes were generated in at least one condition. Microarray data were analyzed using the Linear Mode for Microarray Analysis (LIMMA) software. B statistics with adjusted p value, 0.05 and B.0 were used as threshold for rejection of the null hypothesis (no variation). Supporting information to Fig 2 is presented in S2 Table and S3 Table. Venn diagram representation of gene expression patterns (Panel B) clearly depicted that only 14 DEGs are shared between the three experimental conditions. All DEGs are obtained respect to the control condition. Data used to generate the Venn-diagram were obtained from microarray analysis (S3 Table). Four biological replications of were considered.

