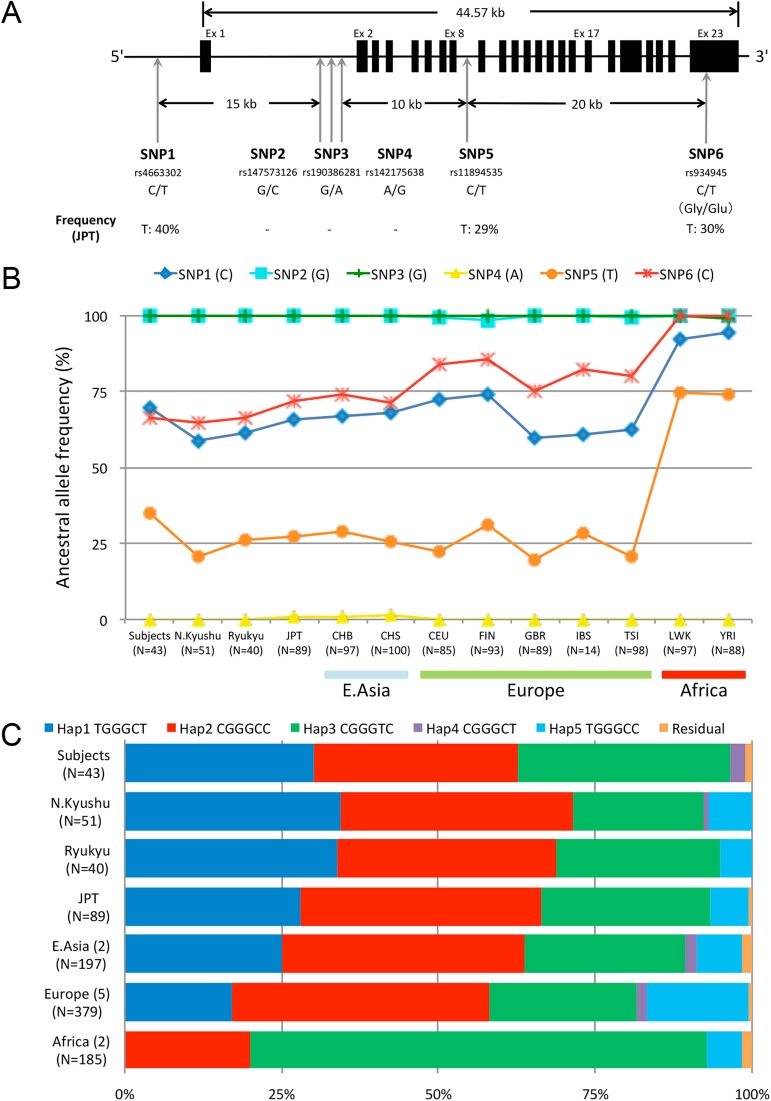
Fig 1. SNPs examined in the PER2 gene and frequencies of the haplotypes in the global populations.
(A) Relative map for the six SNPs examined. The SNPs examined in this study are numbered serially, and their rs numbers, alleles reported, and allele frequencies of JPT in the HapMap database are shown. For the SNP6, the amino acid change (Gly/Glu) has been reported in dbSNP. (B) Ancestral allele frequencies of SNPs in PER2. The allele frequency data from Japan are divided into four groups: subjects with physiological data, Northern Kyushu, Ryukyu, and JPT. Those are compared to three approximate geographic populations: East Asia (CHB, CHS), Europe (CEU, FIN, GBR, IBS, TSI) and Africa (LWK, YRI) from the 1000 Genomes Project database. (C) Haplotype frequencies of PER2 in each geographical region. The numbers of local populations included in the geographical region are shown in parentheses. The N represents the numbers of the individuals. The combined frequencies of the remaining haplotype (Residuals) are less than 1.0% in all the geographical regions, indicating that each haplotype in the residual is extremely uncommon among the samples examined.

