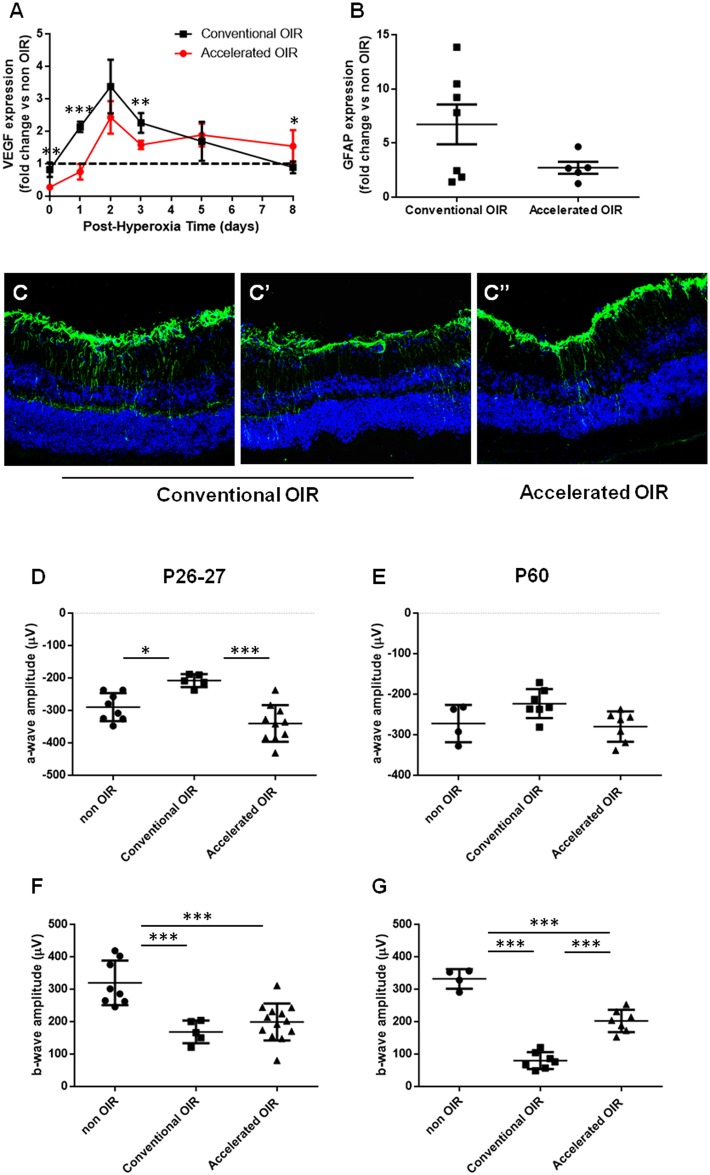
Fig 3. Molecular features and neuroretinal function.
(A) Retinal VEGF was measured by qPCR at intervals (0,1,2,3,5 and 8 days) following exposure to hyperoxia (n = 4–7 per group. (B) GFAP expression measured by qPCR (n = 5–7 per group). (C) Representative images of GFAP immunostaining in retinal sections from mice after the conventional and the accelerated protocol. (C) and (C’) show the variability within the conventional OIR group. (D to G) Electroretinographic (ERG) a-wave and b-wave amplitudes in scotopic conditions were measured at P26-27 (D, E) and at P60 (F, G) in mice previously exposed to the conventional and accelerated OIR protocols, and in age-matched non-OIR controls (n = 4–13 per group). Data are expressed as means ± SEM.

