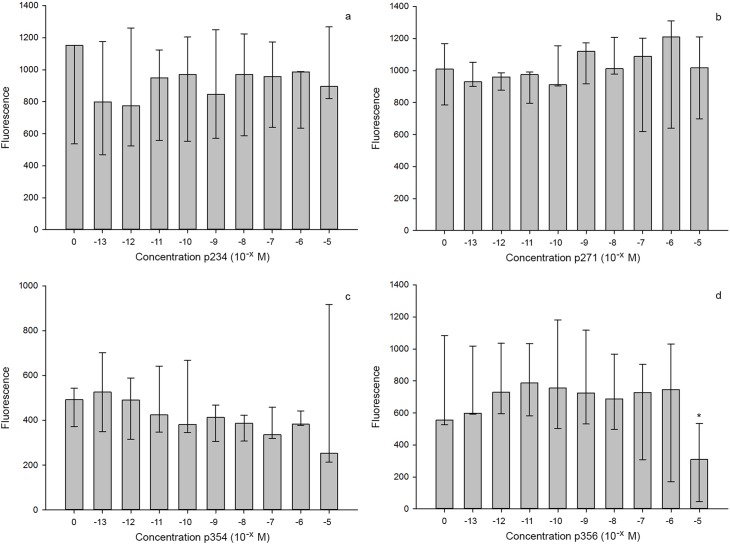
Fig 4. Calcium responses of CHEM1-GPR54 cells to human KP10 after incubation with different concentrations of p234, p271, p354 and p356.
The median (n = 3) Ca2+ response of CHEM1-GPR54 cells to the addition of 10−8 M human KP10 and 10−13–10−5 M of p234 (a), p271 (b), p354 (c), and p356 (d). The error bars represents the range (min and max). * indicates a significant difference from control (no antagonist).

