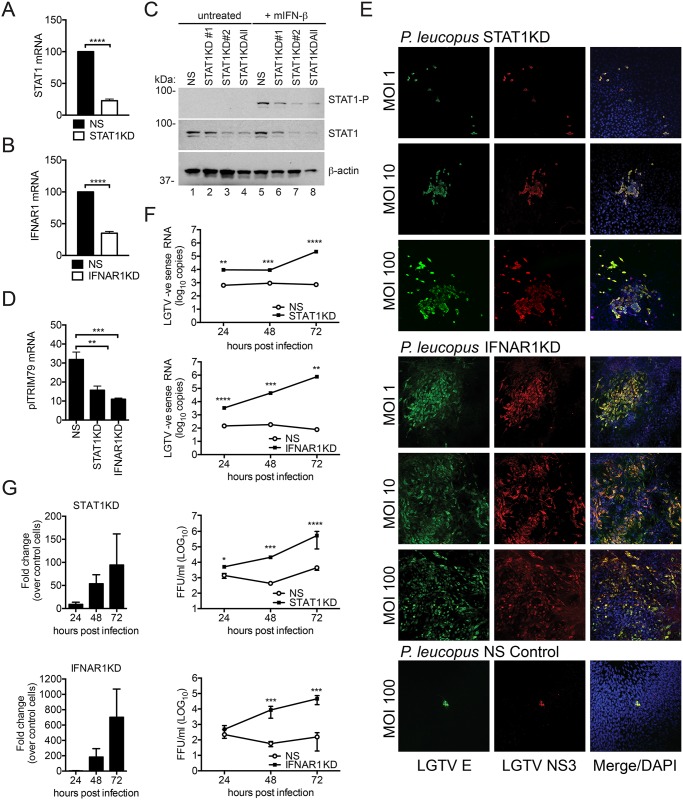
Fig 7. IFN signaling in P. leucopus is critical for the virus restriction phenotype.
Newly-resolved sequence of STAT1 (A) and IFNAR1 (B) were targeted by shRNA technology. Cell lines were generated by lentiviral transduction and cell lysates were assessed for knockdown by qPCR using gene-specific primers. Data are shown as percentage gene expression relative to the NS control. (C) Immunoblot showing expression of STAT1 and STAT1-P in knockdown cells targeted with various short hairpins (#1, #2 and ALL) compared to the non-silencing (NS) control. Cells were treated with mIFN-β for 8 h before cell lysates were harvested. (D) RT-qPCR of ISG plTRIM79 in STAT1KD, IFNAR1KD, and NS control cells treated with mIFN-β. Data are shown as relative fold induction of plTRIM79 compared to mock-treated cells. (E) STAT1KD cells, IFNAR1KD, and control (NS) cells of P. leucopus were infected with LGTV for 72 h and immunostained for the viral E protein (green), NS3 protein (red), and nuclei were stained with DAPI (blue). Cells were visualized by confocal microscopy (20X magnification). (F) STAT1KD cells (top panel) and IFNAR1KD cells (lower panel) of P. leucopus were infected with LGTV at MOI 10. Cell lysates were collected at the indicated time points post-infection and probed for LGTV negative strand (-) RNA by RT-qPCR (as a replication marker). Viral RNA abundance was determined by a standard curve method and compared to the NS control. (G) STAT1KD cells (top panels) and IFNAR1KD cells (lower panels) of P. leucopus were infected with LGTV at an MOI 10. Viral supernatants were collected at the indicated time points and titrated by an immunofocus assay compared to supernatant from the NS control cells. Data presented as fold change relative to NS cells (left panels) or as quantitated virions (right panels). Mean ± SD, Data are from three independent experiments performed in triplicate. Asterisks indicate: ** = p<0.01, *** = p<0.001, **** = p<0.00001.

