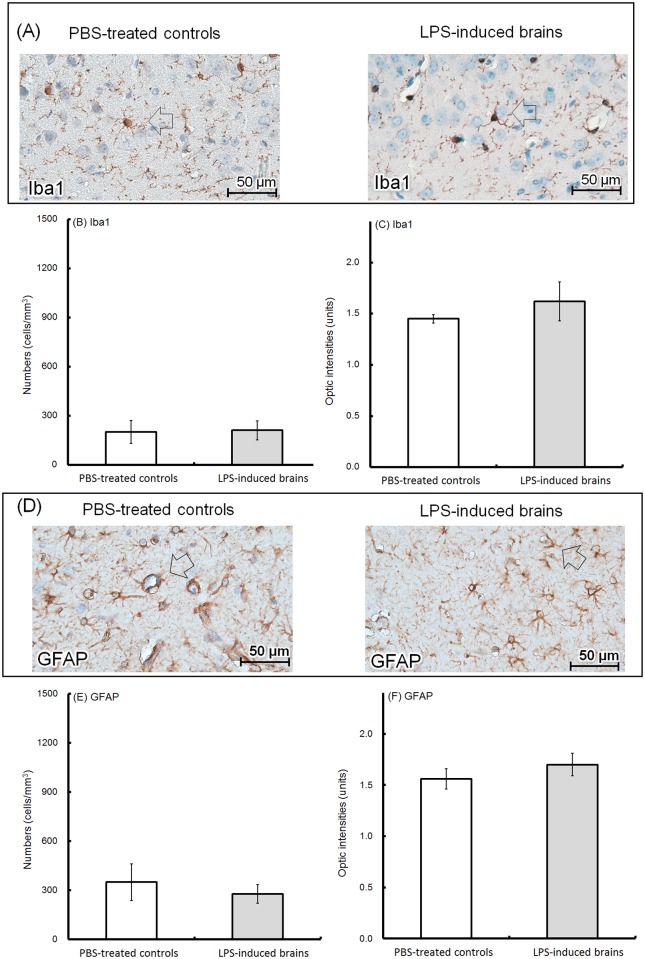
Fig 8. Histological examination of glial cells.
Brains were collected from the 8-week-old offspring. Using immunohistochemistry, representative Iba1-positive microglia in the cerebral cortex are shown (A, left; PBS-treated controls; right; LPS-induced brains; arrow indicated; 400X). The number of Iba1-positive microglia was determined using 10 random microscopic fields (200X) for each brain tissue. The average numbers (cells/mm3) of Iba1-positive microglia in the PBS-treated controls (hollow; n = 6, independent tissues) and LPS-induced brains (solid; n = 6, independent tissues) are shown (B). The optic density (units) of the Iba1-expressing areas was calculated using ImageJ software (open sources, https://imagej.net/Fiji). The average values in the PBS-treated controls (hollow; n = 6, independent tissues) and LPS-induced brains (solid; n = 6, independent tissues) are shown (C). GFAP-positive astrocytes in the surrounding perivascular cuffs of the hippocampus are shown (D, left; PBS-treated controls; right; LPS-induced brains; arrow indicated; 400X). The number of GFAP-expressing astrocytes was determined using 10 random microscopic fields (200X) for each brain tissue. The average numbers (cells/mm3) of GFAP-expressing astrocytes in the PBS-treated controls (hollow; n = 6, independent tissues) and LPS-induced brains (solid; n = 6, independent tissues) are shown (E). The optic densities (units) of the GFAP-expressing areas were calculated using ImageJ software. The average values in the PBS-treated controls (hollow; n = 6, independent tissues) and LPS-induced brains (solid; n = 6, independent tissues) are shown (F).

