
Figure 4.
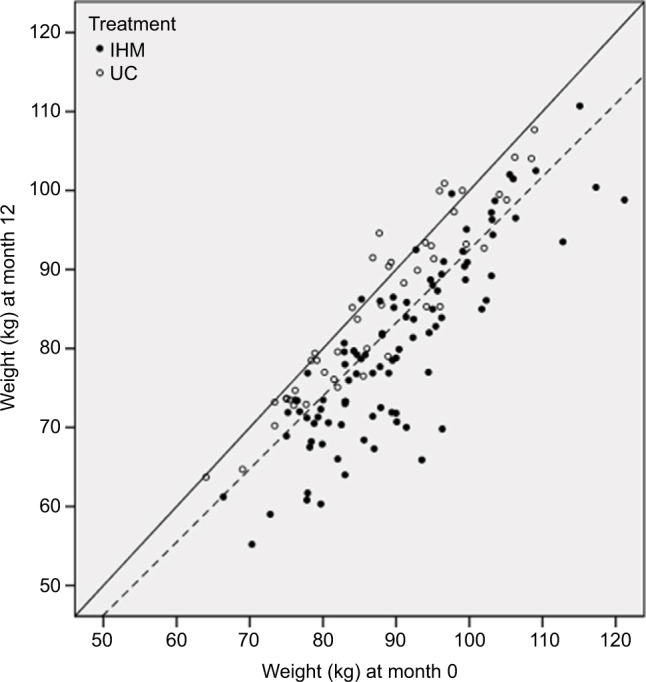
Scatterplot for weight measurements at months 0 and 12 (without imputations).
Notes: Solid line shows diagonal of equal values at both examinations; dashed line represents a 7.5% reduction at month 12.
Abbreviations: IHM, Individual Health Management; UC, usual care.