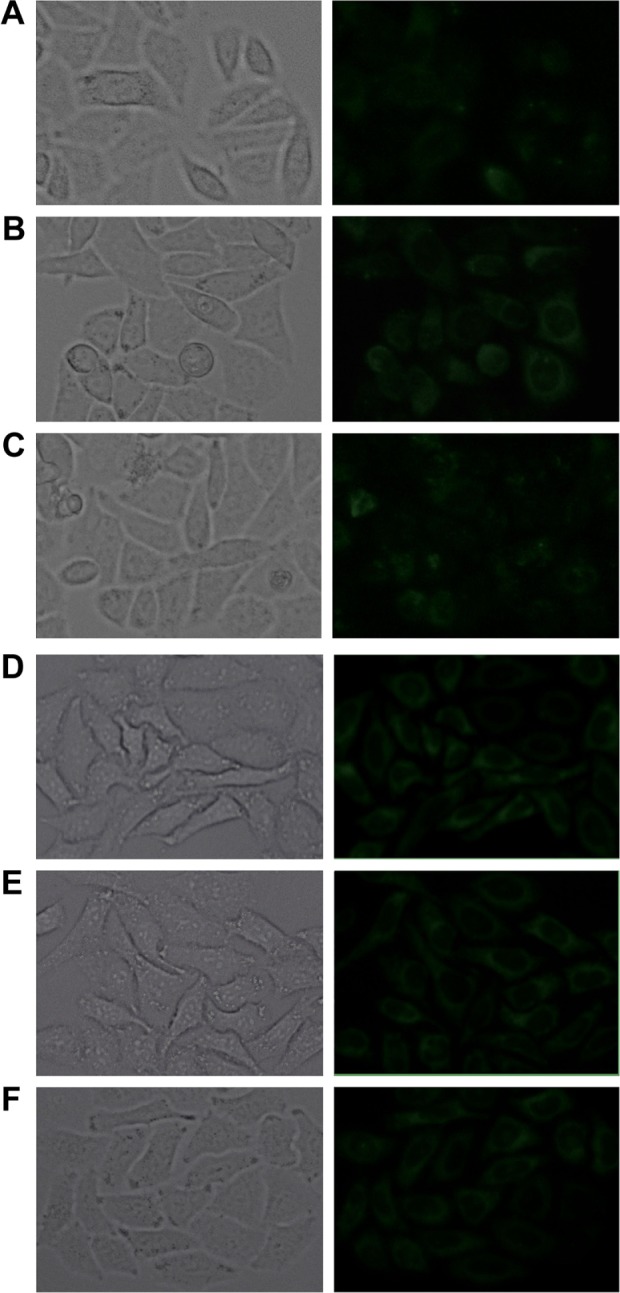
Figure 10.

Fluorescent microscope analysis of L-Ir-1 (A, D), FA-L-Ir-1 (B, E) and FA-L-Ir-1 with 1 mM folic acid preincubated for 2 h (C, F) at Ir-1 concentration of 6.26 μmol/L internalized into HepG2 (A–C) and A549 (D–F) cells after incubation with liposomes for 1 h. Magnification ×200.
