Figure 3.
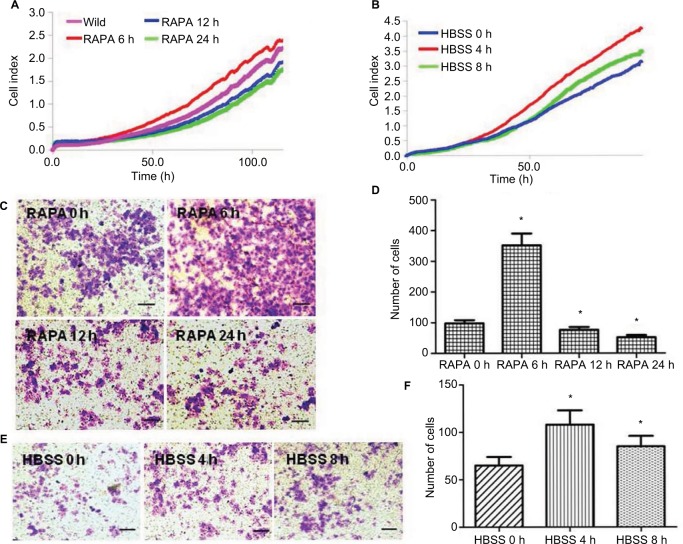
The effects of rapamycin or HBSS on cervical cancer cells. (A) xCELLigence Real-time Cellular Analysis (RCTA) detection of the effects of rapamycin on HeLa cell proliferation at different times. The violet is the wild-type group (0 h), the red represents 6 h, the blue represents 12 h and the green represents 24 h (P<0.05). (B) xCELLigence RTCA detection of the effects of HBSS on HeLa cell proliferation at different times. The blue is 0 h, the red is 4 h and the green is 8 h (P<0.05). (C and D) Transwell test of the invasion ability of HeLa cells treated with rapamycin at different times. The crystal violet staining-positive cells were those who passed through the Matrigel and Transwell (C). The crystal violet staining-positive cells were counted under inverted microscope, and the numbers are shown in the histogram (D). (E and F) Transwell test of the invasion ability of HeLa cells treated with HBSS at different times. The crystal violet staining-positive cells were those who passed through Matrigel and Transwell (E). The crystal violet staining-positive cells were counted under inverted microscope, and the numbers are show in the histogram (F). *P<0.05. Scale bar =100 μm.

