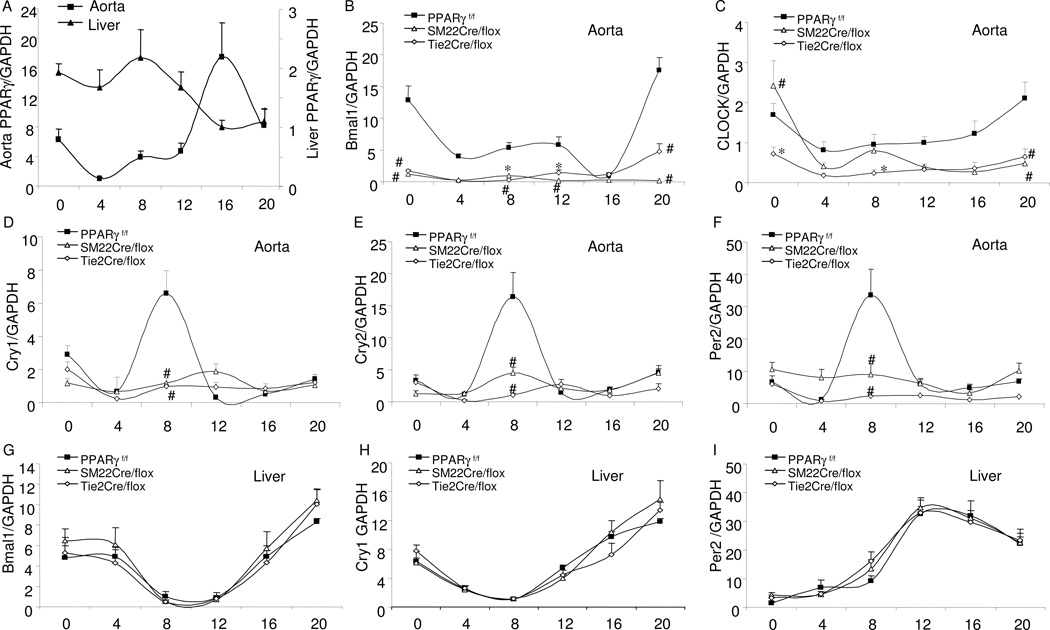
Fig. 4.
Real time RT-PCR of analysis of gene expressions in the aortae and livers of PPARγf/f, SM22Cre/flox and Tie2Cre/flox mice at 4-h intervals. X-axis represents circadian time (CT0, the beginning of subjective light cycle). (A) PPARγ expression in PPARγf/f mice; (B–I) Expressions of canonical clock genes in aortae and livers in the three mouse strains. N=5 in each time point. Shown are mean ± SE. *, P<0.05 and #, P<0.01 vs. PPARγf/f.

