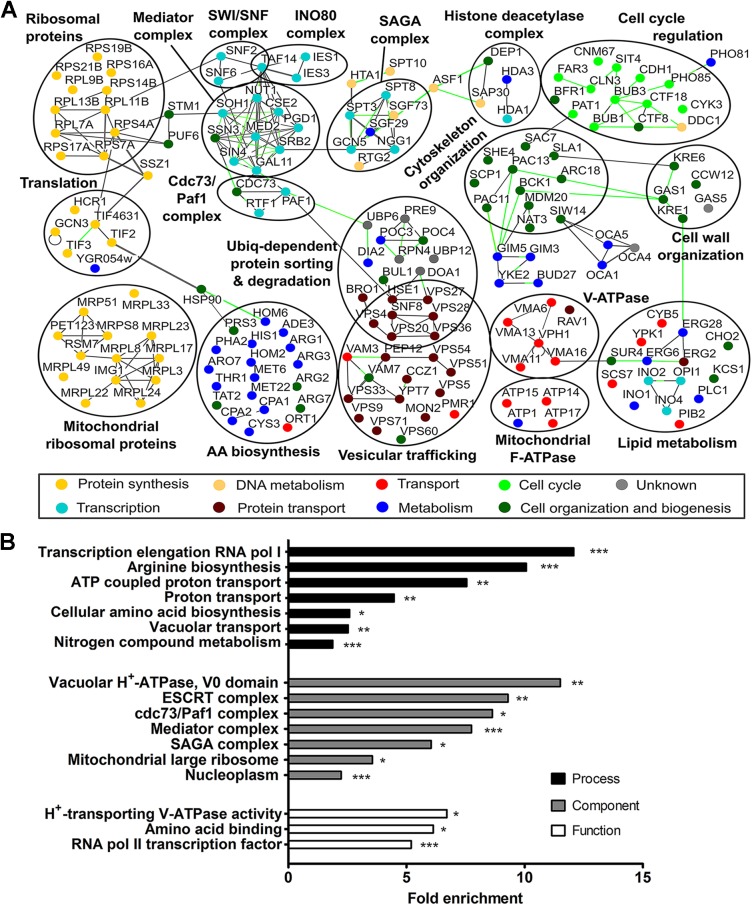
Fig 1. Systematic analysis of genetic interaction partners of SCH9.
(A) SCH9 genetic interaction network. Osprey software was used to graphically display the relationships between genes identified in the SGA screening. Synthetic lethal interactions are connected by green lines; protein-protein interactions are shown in gray. Nodes are colored by process. Circles indicate well-defined protein complexes or group of genes that are functionally related. For clarity reasons, not all identified genes, nor all known interactions are shown. (B) Hypergeometric enrichment organized according to GO function, process and component. See also S1 and S2 Tables.

