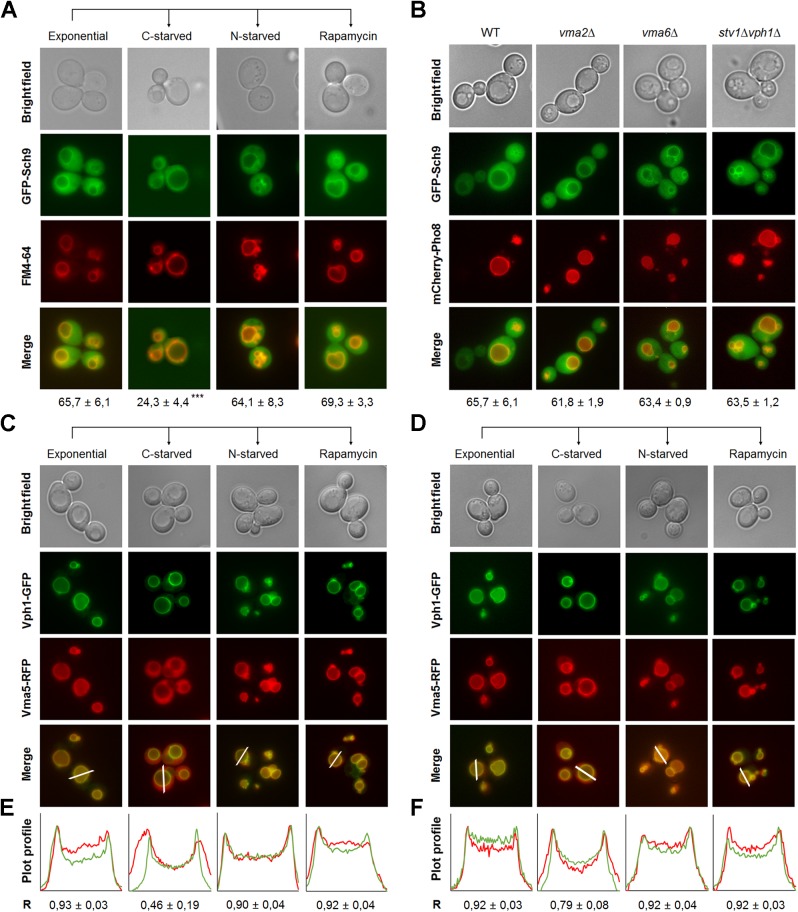
Fig 6. Dynamic localization of Sch9 and its regulation of V-ATPase disassembly.
(A) Vacuolar membrane enrichment of Sch9 is regulated by glucose availability. Cells expressing GFP-Sch9 were grown to exponential phase in minimal medium buffered at pH 5 and stained with FM4-64. Next, cells were washed in starvation medium and deprived of either glucose or nitrogen for 30 min. Alternatively, cells were treated with 200 nM rapamycin. For each condition, vacuolar membrane localization of GFP-Sch9 was assessed for at least 750 cells from three to four independent experiments. Mean values ± SD are shown. A one-way ANOVA analysis was performed to designate statistical differences. (B) V-ATPase activity does not mediate Sch9 localization. Cells of the indicated genotype co-expressing GFP-Sch9 and mCherry-Pho8 were grown to exponential phase in minimal medium buffered at pH 5 and their intracellular localization was analyzed by fluorescence microscopy. Vacuolar membrane localization of GFP-Sch9 was assessed in at least 600 cells from two to three independent experiments. Mean values ± SD are shown. (C-F) Sch9 regulates V-ATPase disassembly in response to glucose availability. WT (C) and sch9Δ (D) cells co-expressing Vma5-RFP and Vph1-GFP were grown as in Fig 6A and their intracellular localization was analyzed by fluorescence microscopy. (E, F) Combined fluorescence intensity profile plots of Vma5-RFP (red) and Vph1-GFP (green) measured along the line displayed in the merged panel for WT (E) and sch9Δ (F) cells. The x-axis depicts the distance along the line in pixels, while the y-axis indicates the relative RFP or GFP signal intensities. The Pearson’s coefficient (R) ± SD was calculated using the ImageJ plugin JACoP. See also S9 Fig.

