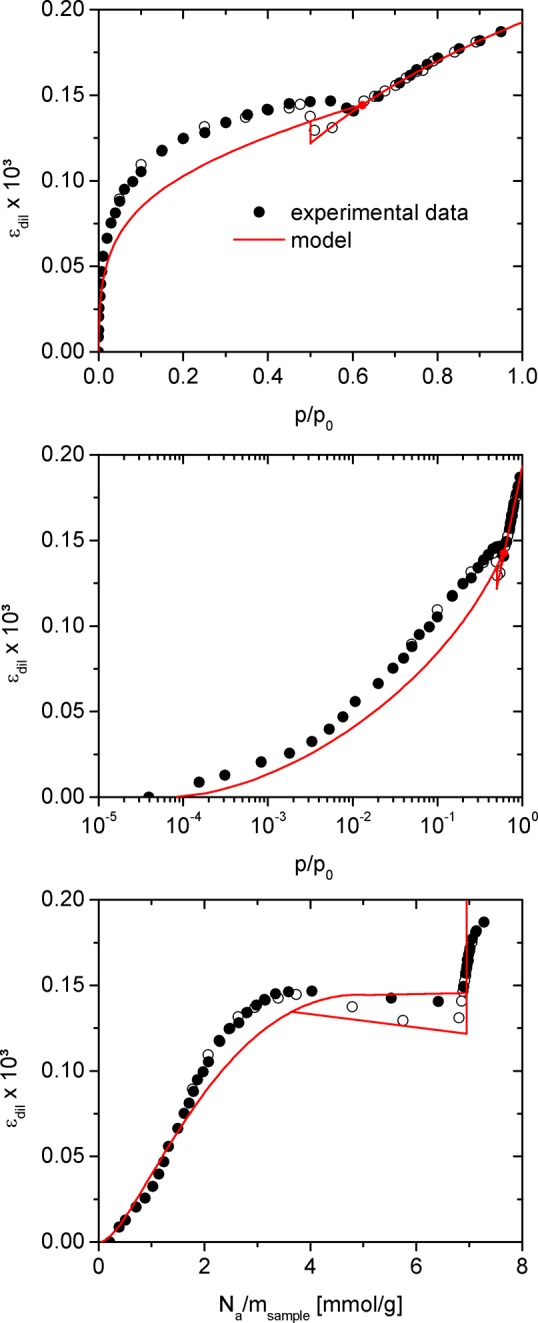
Figure 8.

Dilatometric strain εdil for the sample investigated obtained during N2 adsorption at 77 K and the respective prediction from eq 20. The upper panel shows the strains as a function of relative pressure on linear scale, the middle panel as a function of relative pressure on logarithmic scale and the lower panel as a function of specific amount adsorbed. The red dot in upper and middle panel indicates the point of capillary condensation as predicted by the model.
