
Fig. 4.
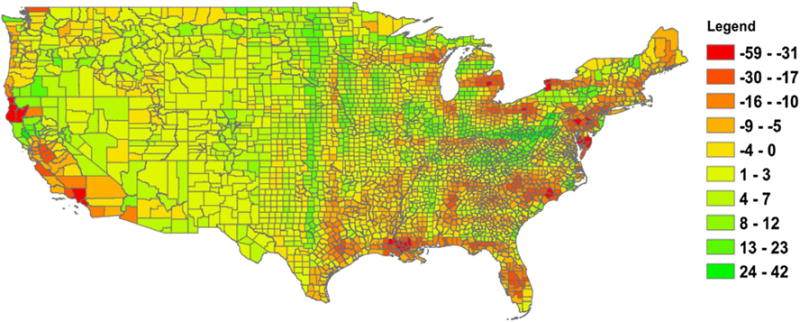
The population-normalized difference in estimated mortality by county attributed to total PM2.5 between the fine-model resolution (0.5 × 0.66°) and the coarse resolution (2 × 2.5°) (calculated as the coarse resolution estimate minus the fine resolution estimate, divided by population; shown as difference in mortality per 100,000 people)