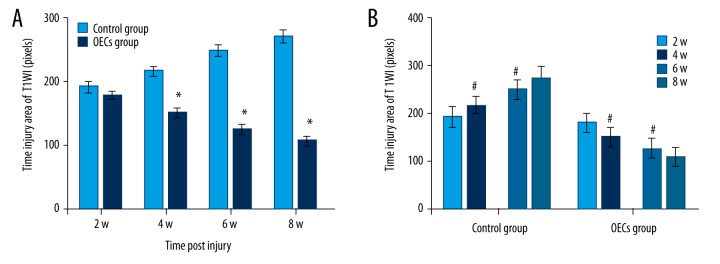
Figure 4.
The injury area of T1WI after contusive spinal cord injury. Data of rats for each group (n=6) at each time point after injury were analyzed and are presented as mean ±SD. (A) The injury area of T1WI between 2 groups were compared at week 2, week 4, week 6, and week 8 after injury. (B) Comparisons were performed between 2 adjacent time points in each group. * P<0.05 OECs group vs. time-matched control group. # P<0.05 current time point vs. previous time point.

