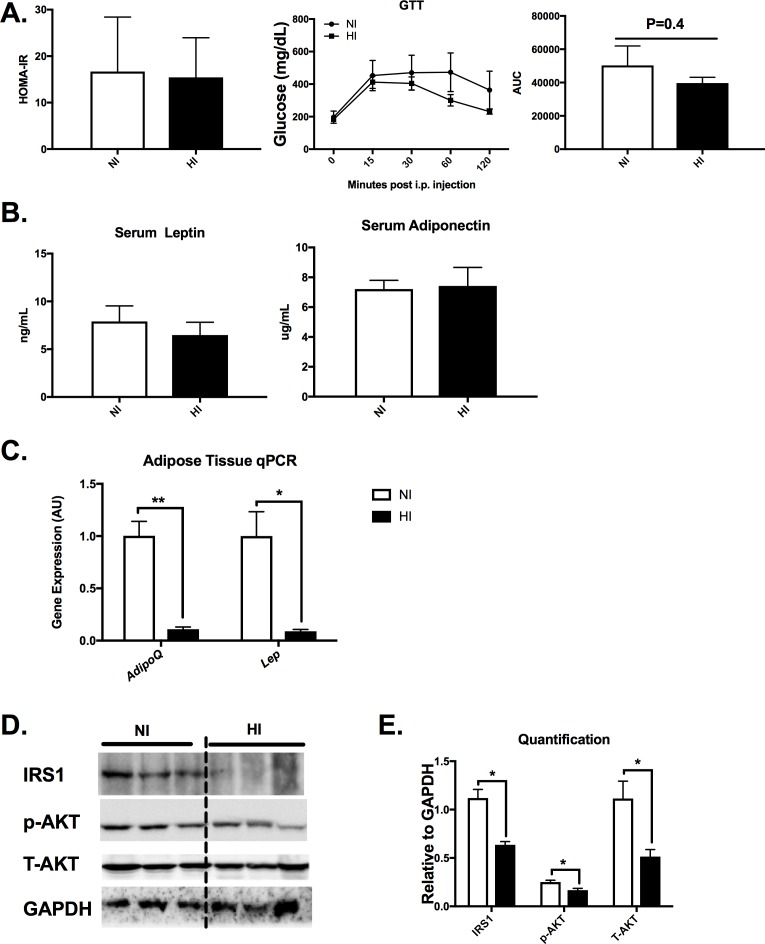
Fig 6. Local glucose homeostasis was impaired with increased adipose tissue iron accumulation.
A) Insulin resistance index HOMA-IR, glucose tolerance test (GTT) and the area under the curve (AUC) in both NI and HI groups. B)Serum adiponectin and leptin in NI (n = 6) and HI (n = 4) mice. C) adipose tissiue gene expression with adipokine markers in NI and HI groups. D&E) adipose tissue insulin signaling protein levels and the quantification after normalizing with GAPDH. *p< 0.05.

