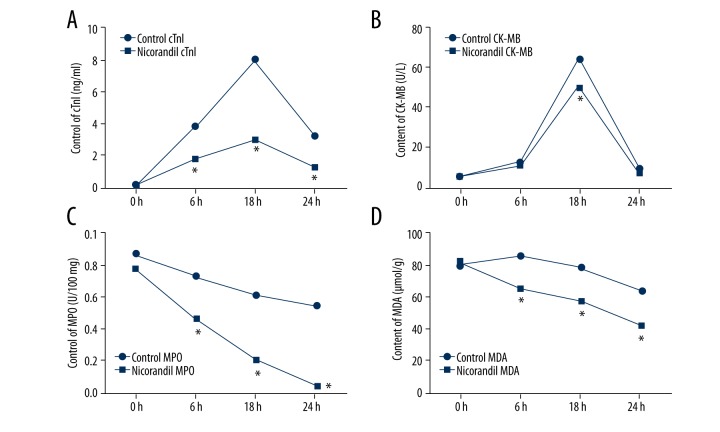
Figure 2.
Comparison of levels of cTnI, CK-MB, MPO, and MDA. The plasma levels of cTnI, CK-MB, MPO, and MDA before and at 6, 18, and 24 h after PCI in the 2 groups were analyzed. (A) Plasma levels of cTnI. (B) Plasma levels of CK-MB. (C) Plasma levels of MPO. (D) Plasma levels of MDA. cTnI – cardiac troponin I; CK-MB – creatine kinase-MB; MPO – myeloperoxidase; MDA – malondialdehyde; PCI – percutaneous coronary intervention. * P<0.05 compared to the control group.

