. 2017 Jun 26;6:e17331. doi: 10.7554/eLife.17331

Figure 1. Interaction between the accuracies at L1 and L2.

We computed the psychometric function for the L2 decision for trials with a correct (green traces) or erroneous (red) decision at L1. Left, H and M model with infinite bounds collapsing after 500 ms. Middle, H and M model with high bounds that are stable. Right, data of the monkeys in Lorteije et al. (2015). Green/red regions, s.e.m.

DOI: http://dx.doi.org/10.7554/eLife.17331.003

Figure 1.

Figure 1—figure supplement 1. Reaction times for model and data.
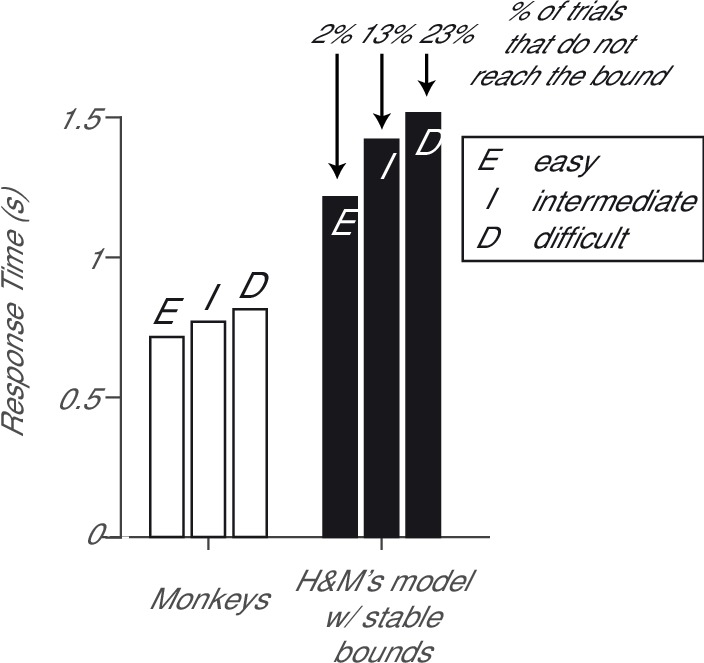
Figure 1—figure supplement 1.

The monkeys’ response times (white bars) exhibit a substantial increase with the difficulty of the stimulus, as expected from a decision process in which evidence is accumulated to a bound (see also Figure S1D in Lorteije et al., 2015). The model of Hyafil and Moreno-Bote with stable high bounds produces unrealistically long response times (black bars) and the decision variable does not reach the bound in a large fraction of the trials.