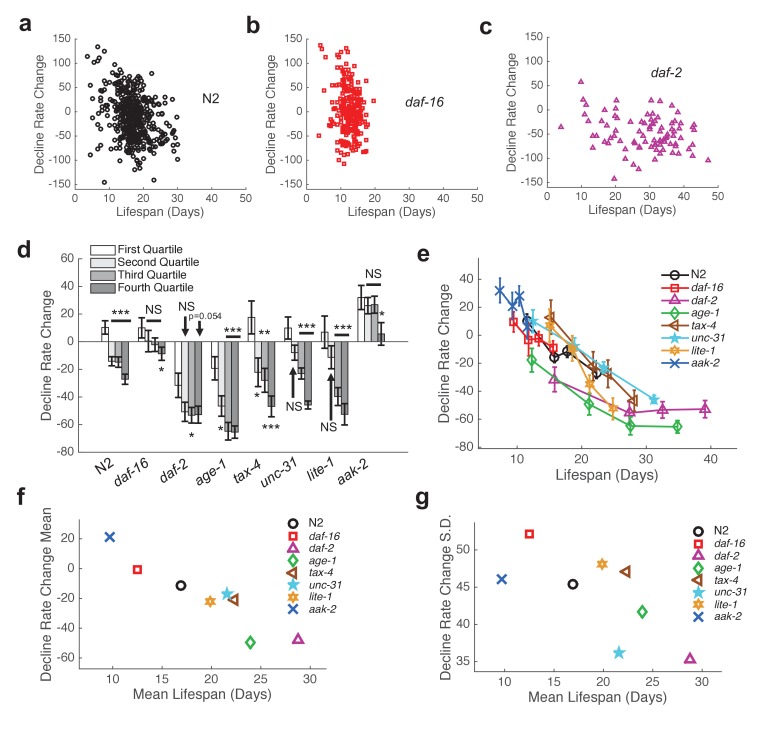
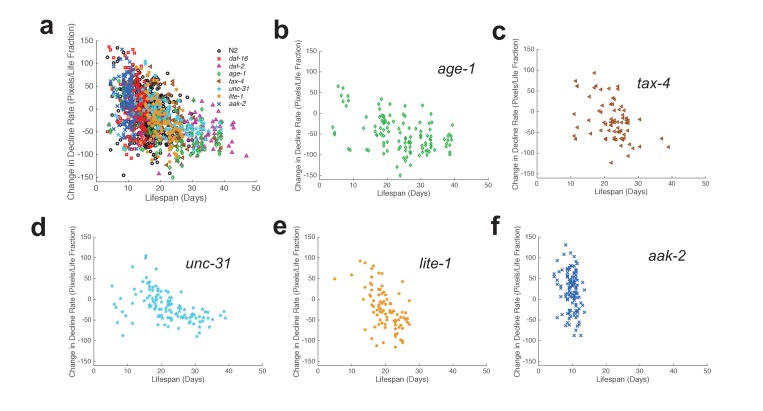
Figure 6. Shape of behavioral decline changes continuously with lifespan across individuals and strains.
(a) Change in decline rate (pixels/life fraction) versus lifespan for individual N2 animals. (b) Same data as in panel (a) presented for daf-16 mutants. (c) Same data as in panel (a) presented for daf-2 mutants. (d) Change in decline rate (pixels/life fraction) in lowest (white) to highest (dark gray) survivor quartiles. *, p<0.05; **, p<0.01; ***, p<0.001. (e) Change in decline rate (pixels/life fraction) versus lifespan for multiple strains. (f) Mean decline rate change (pixels/life fraction) plotted against mean lifespan for each strain tested. Correlation coefficient r = −0.94, p=0.0006. (g) Standard deviation of decline rate change (pixels/life fraction) plotted against mean lifespan for each strain tested. Correlation coefficient r = −0.70, p=0.055.


