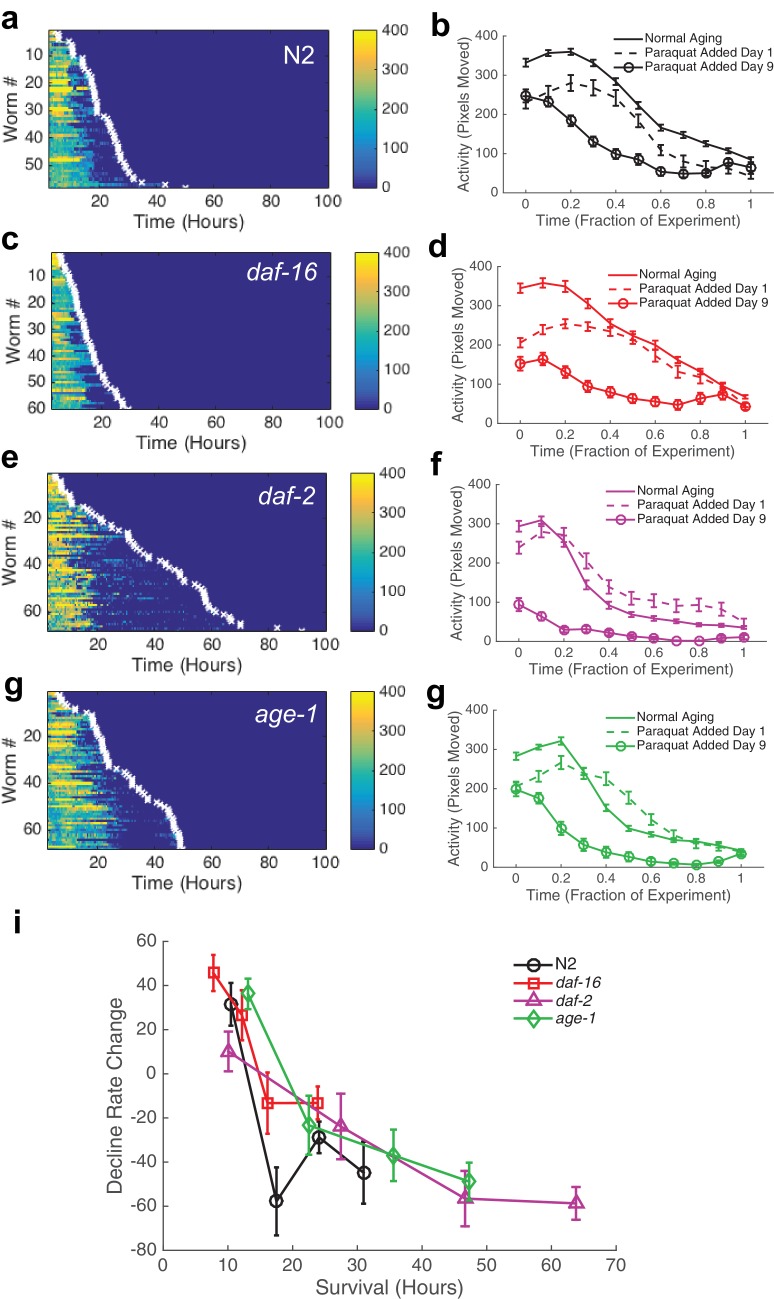
Figure 7. Behavioral decline during acute oxidative stress resembles behavioral decline during aging.
(a, c, e, g) Behavior and survival heat maps for N2 (n = 58), daf-16 (n = 60), daf-2 (n = 68), and age-1 (n = 68). (b, d, f, h) Comparison of behavioral decline during normal aging (solid curve), stress with paraquat added on day 1 of adulthood (dashed curve), and stress with paraquat added on day 9 of adulthood (solid curve with circles) (i) Change in decline rate (pixels/life fraction) for individuals versus survival on paraquat.
DOI: http://dx.doi.org/10.7554/eLife.26652.022

