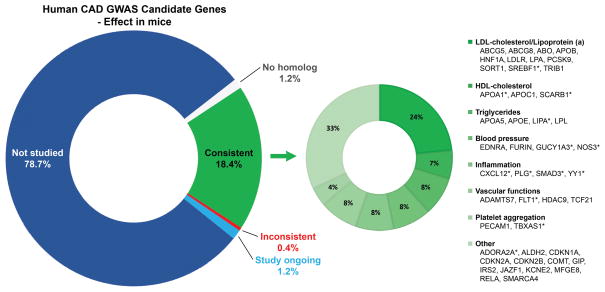
Figure 1. Human CAD GWAS candidate genes – focus on genes already validated in mice.
The pie chart (left) shows human CAD GWAS candidate genes grouped into those not yet studied in mice (blue), studied in experimental models with consistent effects (green) or inconsistent effects (red) and genes with no human homolog (white). The second pie chart shows the percentage of genes contributing to CAD associated traits or functions (right). Genes with pleiotropic effects are arranged according to their most dominant contribution.

