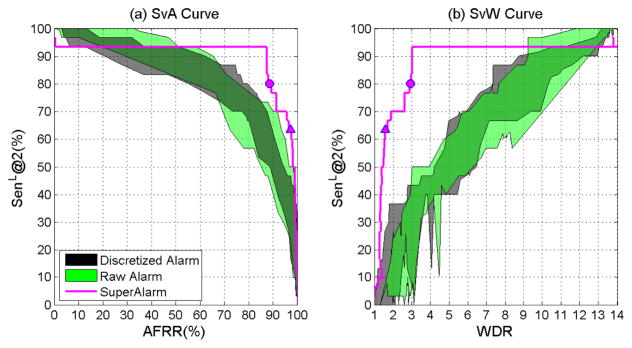
Fig. 5.
(a) SvA curve: SenL@2 versus AFRR.(b) SvW curve: SenL@2 versus WDR. The ranges are displayed for discretized alarm sequences (black) and raw alarm sequences (green) under all specified subsequence lengths (from 2 hours to ∞). The curves for SuperAlarm sequences (magenta) are created based on the 12-hour subsequence length. The circle on the curve represents the pair of values obtained using the optimal SVM threshold while the triangle on the curve represents that obtained using the default SVM threshold (i.e., zero).

